


Central Garden & Pet Announces Q3 Fiscal 2026 Financial Results
Central Garden & Pet Announces Q3 Fiscal 2026 Financial Results

Wed, August 5, 2026 at 8:01 PM UTC
0
WALNUT CREEK, Calif.--(BUSINESS WIRE)--Aug 5, 2026--
Central Garden & Pet Company (NASDAQ: CENT) (NASDAQ: CENTA) (“Central”), a leading consumer goods company in the pet and garden industries, today announced financial results for its fiscal 2026 third quarter ended June 27, 2026.
This press release features multimedia. View the full release here: https://www.businesswire.com/news/home/20260805868011/en/
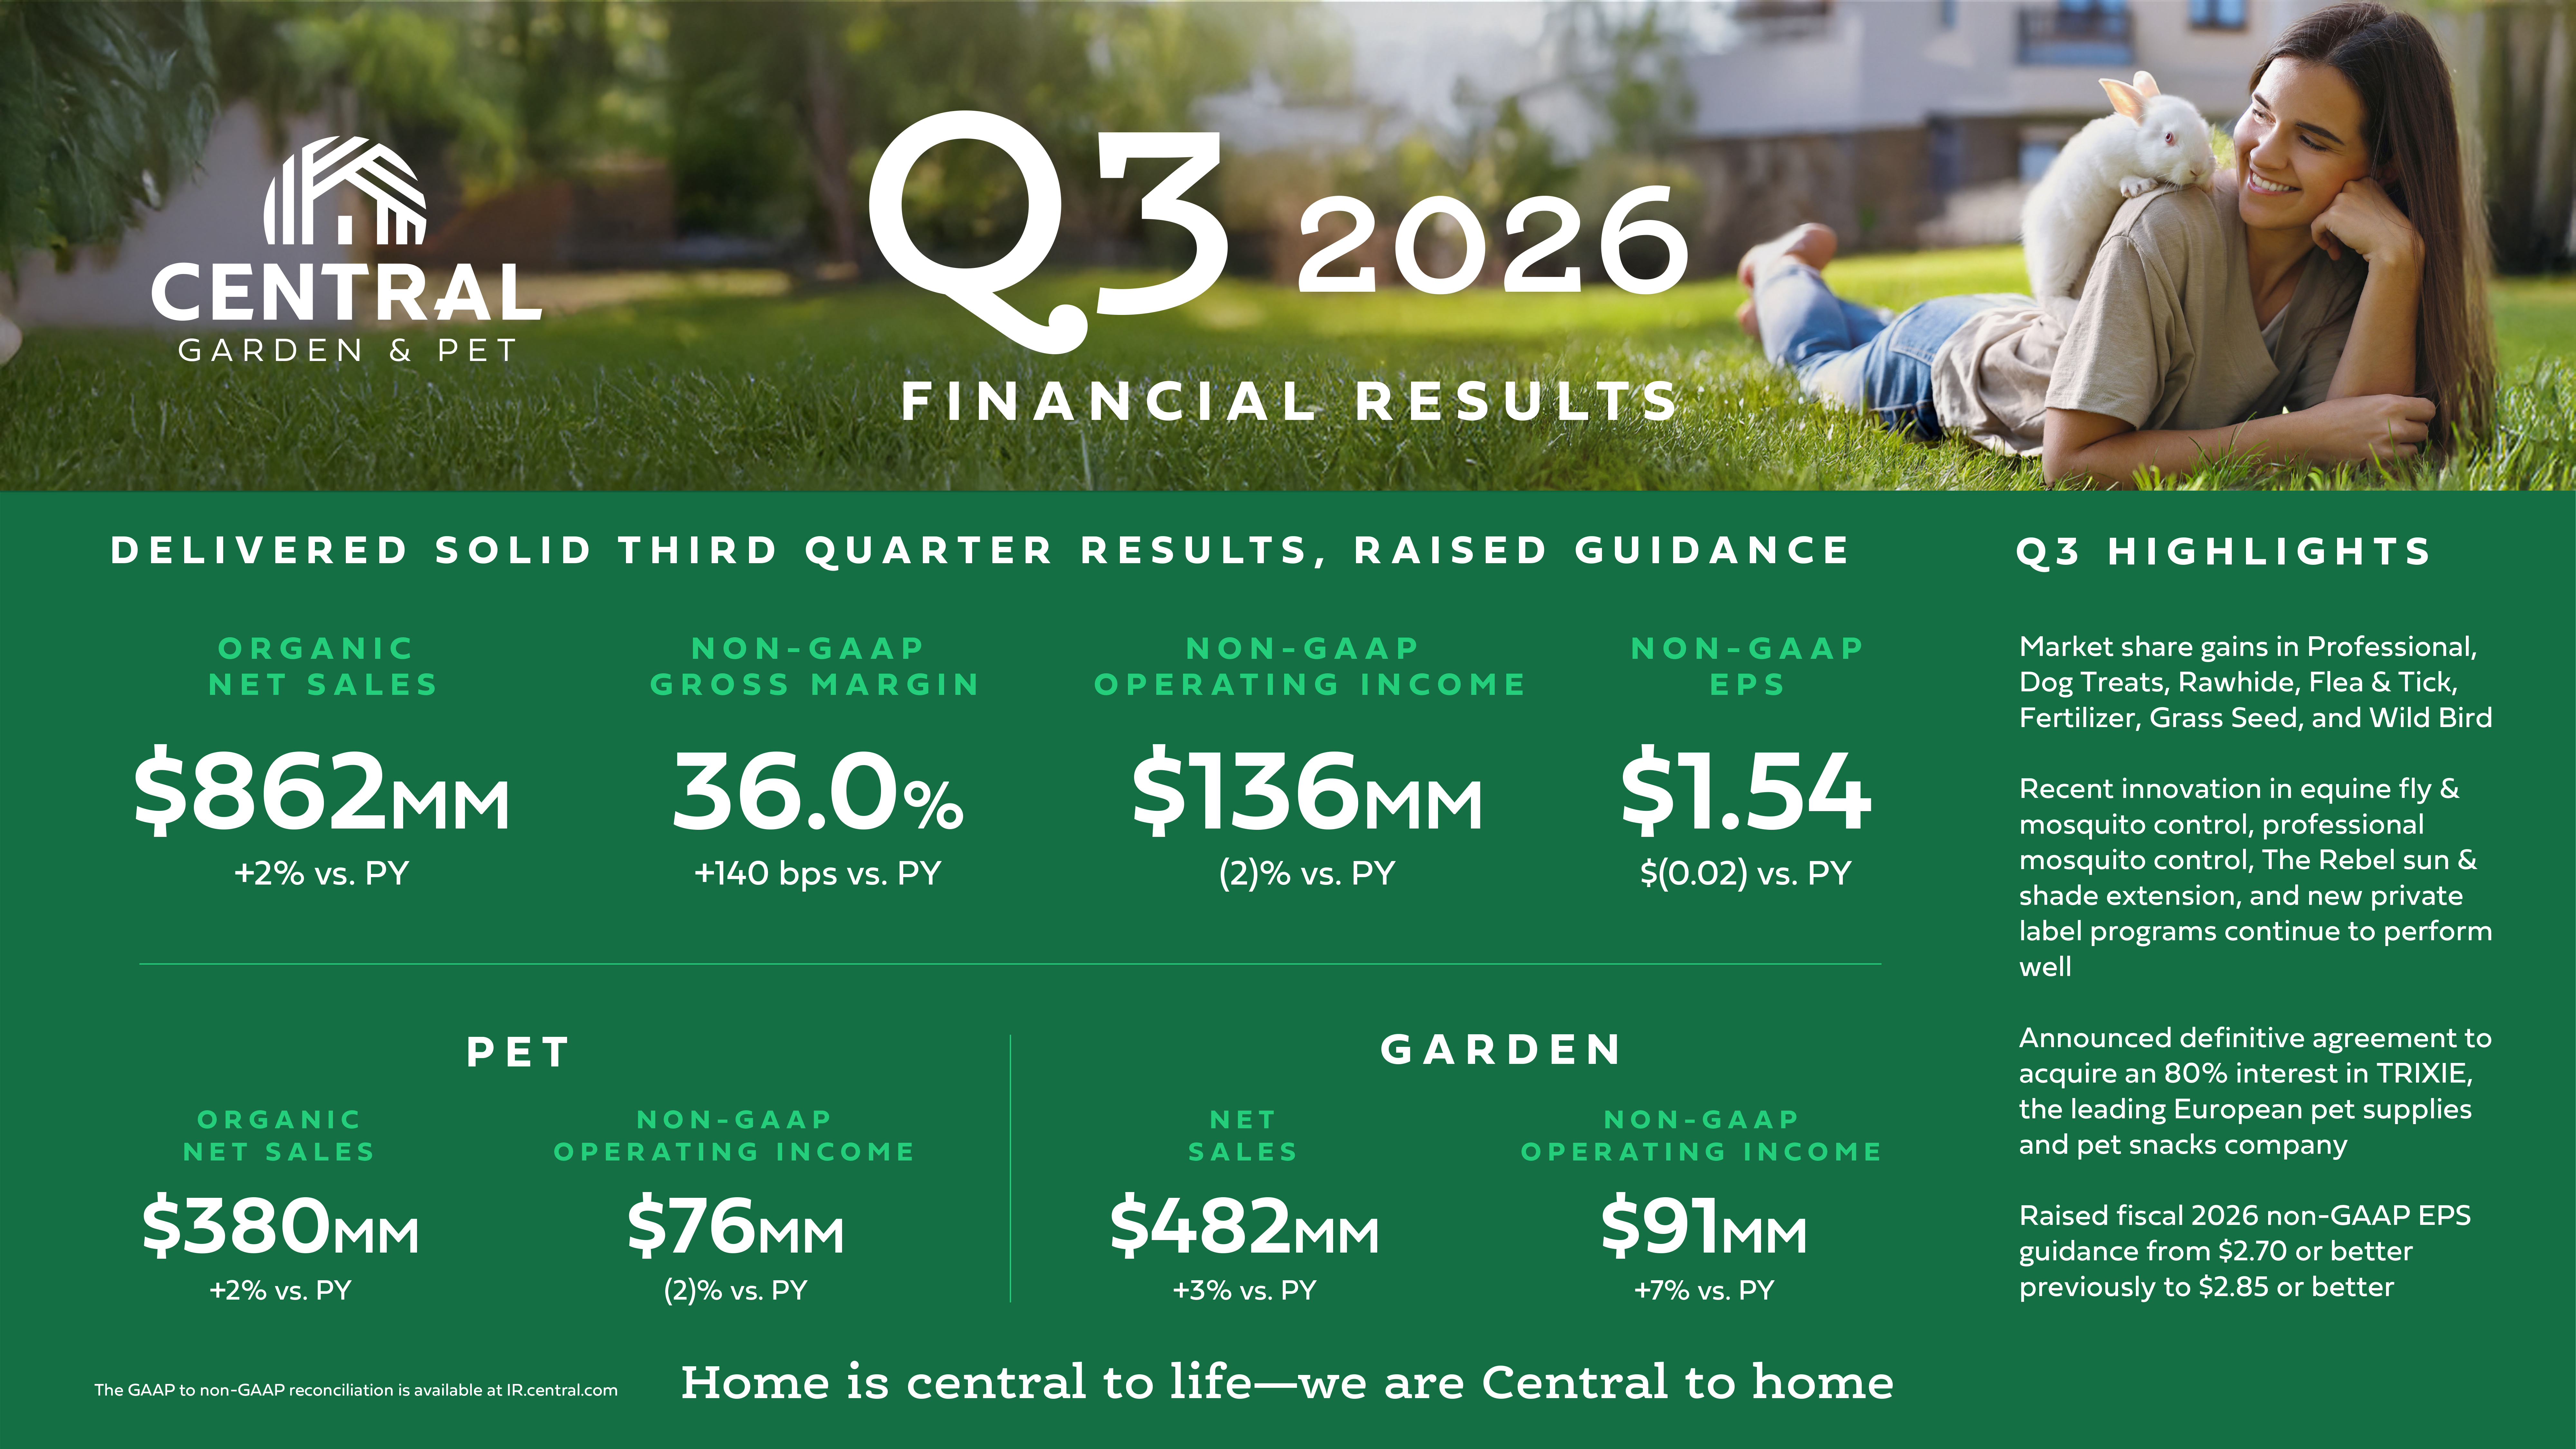
Central Garden & Pet raises fiscal 2026 outlook for non-GAAP diluted EPS from $2.70 or better to $2.85 or better
"Third quarter results showed continued strength across the business with improvements in both organic sales and margins versus last year, reflecting sharp execution and favorable margins due primarily to the exit of the pet distribution business earlier this year. Following the quarter, we entered into a definitive agreement to acquire a majority interest in TRIXIE, the leading European pet supplies and pet snacks company, a significant step in expanding our presence in Europe," said Niko Lahanas, CEO of Central Garden & Pet. "As we enter the final phase of the garden season, and given the strength we've seen across the business, we're raising our fiscal year outlook."
Fiscal 2026 Third Quarter Financial Results
(All comparisons versus Q3 FY 2025)
Net sales were $882 million compared with $961 million, a decrease of 8%. Organic net sales, which take into account the exit of the pet distribution business at the beginning of the quarter, were $862 million compared with $842 million, an increase of 2%.
Gross profit was $317 million, compared with $332 million, a decrease of 5%, with gross margin expanding by 130 basis points to 35.9% from 34.6%.
SG&A was $191 million, compared with $197 million, a decrease of 3%. Non-GAAP SG&A was $182 million, compared with $193 million, a decrease of 6%.
Operating income totaled $126 million, compared with $135 million, a decrease of 7%, with operating margin expanding by 20 basis points to 14.3% from 14.1%. On a non-GAAP basis, operating income totaled $136 million, compared with $139 million, a decrease of only 2%, with operating margin expanding by 90 basis points to 15.4% from 14.5%.
Other income was $2 million, slightly above the prior year.
Net interest expense was $8 million, lower than a year ago.
Net income was $90 million, compared with $95 million, a decrease of 5%, or $1.45 per diluted share compared with $1.52, a decrease of $0.07. On a non-GAAP basis, net income was $96 million, compared with $98 million, a decrease of 2%, or $1.54 per diluted share compared with $1.56, a decrease of $0.02.
Adjusted EBITDA was $162 million, compared with $167 million, a decrease of $5 million, with margin expanding by 100 basis points to 18.3% from 17.3%.
Pet Segment Third Quarter Fiscal 2026 Results
(All comparisons versus Q3 FY 2025)
Net sales in the Pet segment were $400 million, compared with $493 million, a decrease of 19% reflecting the exit of the pet distribution business. Organic net sales in the Pet segment were $380 million, an increase of 2%.
Operating income was $67 million, compared with $76 million, a decrease of 12%, with margin of 16.7% versus 15.5%, up 120 basis points. Non-GAAP operating income was $76 million, compared with $78 million, a decrease of 2%, with margin of 19.0% versus 15.8%, up 320 basis points.
Adjusted EBITDA was $86 million, compared with $88 million, a decrease of $2 million, with margin of 21.4% versus 17.9%, up 350 basis points.
Garden Segment Third Quarter Fiscal 2026 Results
(All comparisons versus Q3 FY 2025)
Net sales in the Garden segment were $482 million, compared with $468 million, an increase of 3%. The increase was primarily driven by Wild Bird, Fertilizer and Controls, and Grass Seeds.
Operating income was $90 million, compared with $83 million, an increase of 9%, with margin expanding by 100 basis points to 18.7% from 17.7%. Non-GAAP operating income was $91 million, compared with $85 million, an increase of 7%, with margin of 18.9% versus 18.2%, up 70 basis points.
Adjusted EBITDA was $101 million, compared with $96 million, an increase of $5 million, with margin of 20.9% versus 20.4%, up 50 basis points.
Liquidity and Debt
(All comparisons versus Q3 FY 2025)
Cash provided by operations was $327 million, compared with $265 million, primarily reflecting seasonal changes in working capital.
Cash and cash equivalents at June 27, 2026, totaled $997 million, compared with $713 million.
Total debt was $1.2 billion, consistent with the prior year period, with strong liquidity supporting continued investment capacity and financial flexibility.
Gross leverage, calculated using the definitions for Indebtedness and EBITDA in Central's credit agreement, ended the third quarter at 2.8x, compared with 2.9x in the prior year and below the target range of 3.0 to 3.5x. Net leverage was 0.5x.
As of June 27, 2026, $128 million remained available for future stock repurchases.
Acquisition of TRIXIE
Following the close of the quarter, Central entered into a definitive agreement to acquire an 80% interest in TRIXIE Heimtierbedarf GmbH & Co. KG (“TRIXIE”), the leading European pet supplies and pet snacks company, for €340 million in cash at closing plus up to €60 million in additional earn-out payments, for total consideration of up to €400 million. Together, Central and TRIXIE will create the leading global player in pet supplies.
Advertisement
TRIXIE serves over 30,000 pet retail stores internationally with a broad portfolio of pet products, approximately 90% of which are own-brand. The transaction will give Central a differentiated presence with approximately 10% of net sales generated outside of the United States and establish a scaled platform to consolidate the fragmented European pet specialty market. Members of TRIXIE's leadership team will retain a minority stake and continue in key roles. The transaction is expected to close in the first half of fiscal 2027.
Fiscal 2026 Guidance
Reflecting year-to-date results and improved visibility into the balance of the year, Central raises its outlook for fiscal 2026 non-GAAP diluted EPS from $2.70 or better to $2.85 or better, driven by continued margin discipline, ongoing investment in growth initiatives, and portfolio optimization.
The outlook incorporates current assumptions regarding a competitive and promotional retail environment, a value-oriented consumer, existing tariffs, and inflation in select commodities. It also assumes continued stability across key commodities despite a dynamic macroeconomic and geopolitical backdrop.
Capital expenditures for fiscal 2026 are projected to be approximately $50 million, focused on maintenance, productivity initiatives, and targeted growth investments across both segments.
This outlook excludes any potential impacts from further acquisitions, divestitures, or restructuring activities that may occur during the remainder of fiscal 2026, including projects under Central's Cost and Simplicity agenda, as well as further tariff refunds.
Conference Call
Central will hold a conference call today at 4:30 p.m. Eastern Time (1:30 p.m. Pacific Time), hosted by CEO Niko Lahanas and CFO Brad Smith, to discuss these results and to provide a general business update. The conference call and related materials can be accessed at http://ir.central.com.
Alternatively, to listen to the call by telephone, dial (201) 689-8345 (domestic and international) using confirmation #13760653.
About Central Garden & Pet
Central Garden & Pet Company (NASDAQ: CENT) (NASDAQ: CENTA) is a leading consumer goods company in the pet and garden industries. Guided by the belief that home is central to life, the company's purpose is to proudly nurture happy and healthy homes. For over 45 years, its innovative and trusted solutions have helped lawns grow greener, gardens bloom bigger, pets live healthier, and communities grow stronger. Central is home to a diversified portfolio of market-leading brands including Amdro ®, Aqueon ®, Best Bully Sticks ®, Cadet ®, C&S ®, Farnam ®, Ferry-Morse ®, Kaytee ®, Nylabone ®, Pennington ®, Sevin ® and Zoёcon ®. With fiscal 2025 net sales of $3.1 billion, the company has strong manufacturing and logistics capabilities supported by a passionate, entrepreneurial growth culture that incorporates sustainability. Central is headquartered in Walnut Creek, California, and employs more than 6,000 people, primarily across North America. Visit www.central.com to learn more.
Safe Harbor Statement
“Safe Harbor” Statement under the Private Securities Litigation Reform Act of 1995: The statements contained in this release which are not historical facts, including statements concerning evolving consumer demand and unfavorable retailer dynamics, productivity initiatives, estimated capital spending, earnings guidance for fiscal 2026, the expected timing of the closing of the acquisition of TRIXIE, and our ability to successfully manage and grow TRIXIE’s business, are forward-looking statements that are subject to risks and uncertainties that could cause actual results to differ materially from those set forth in or implied by forward-looking statements. All forward-looking statements are based upon Central's current expectations and various assumptions. There are a number of risks and uncertainties that could cause actual results to differ materially from the forward-looking statements contained in this release including, but not limited to, the following factors:
economic uncertainty and other adverse macroeconomic conditions, including a potential recession or inflationary pressure;
impacts of further tariffs or a trade war and our ability to receive tariff refunds;
risks associated with international sourcing;
the failure to obtain certain required regulatory approvals or the failure to satisfy any of the other closing conditions to the completion of the TRIXIE transaction;
our ability to close the TRIXIE acquisition in a timely basis or at all;
our ability to integrate the acquired company and realize the potential benefits of the TRIXIE transaction to Central and our customers;
fluctuations in energy prices, fuel and related petrochemical costs;
the impact of the new pet distribution partnership on our financial results and ability to distribute and promote our pet branded products;
declines in consumer spending and the associated increased inventory risk;
seasonality and fluctuations in our operating results and cash flow;
adverse weather conditions and climate change;
the success of our Central to Home strategy and our Cost and Simplicity agenda;
fluctuations in market prices for seeds and grains and other raw materials, including the impact of significant declines in grass seed market prices on our inventory valuation;
risks associated with new product introductions, including the risk that our new products will not produce sufficient sales to recoup our investment;
dependence on a small number of customers for a significant portion of our business;
consolidation trends in the retail industry;
supply shortages in pet birds, small animals and fish;
potential credit risk associated with certain brick and mortar retailers in the pet specialty segment;
reductions in demand for our product categories;
competition in our industries;
continuing implementation of an enterprise resource planning information technology system;
regulatory issues;
potential environmental liabilities;
access to and cost of additional capital;
the impact of product recalls;
risks associated with our acquisition strategy, including our ability to successfully integrate acquisitions and the impact of purchase accounting on our financial results;
potential goodwill or intangible asset impairment;
the potential for significant deficiencies or material weaknesses in internal control over financial reporting, particularly of acquired companies;
our dependence upon our key executives;
our ability to recruit and retain members of our management team and employees to support our businesses;
potential costs and risks associated with actual or potential cyberattacks;
our ability to protect our trademarks and other proprietary rights;
litigation and product liability claims;
the impact of new accounting regulations and the possibility our effective tax rate will increase as a result of future changes in the corporate tax rate or other tax law changes;
potential dilution from issuance of authorized shares; and
the voting power associated with our Class B stock.
These and other risks are described in greater detail in Central’s Annual Report on Form 10-K for the fiscal year ended September 27, 2025, filed with the Securities and Exchange Commission on November 26, 2025. Central has not filed its Form 10-Q for the fiscal quarter ended June 27, 2026. As a result, all financial results described here should be considered preliminary, and are subject to change to reflect any necessary adjustments or changes in accounting estimates that are identified prior to the time the Company files the Form 10-Q. Central assumes no obligation to publicly update these forward-looking statements to reflect new information, future events, or any other development.
CENTRAL GARDEN & PET COMPANY
(in thousands, except share and per share amounts, unaudited)
June 27, 2026
June 28, 2025
September 27, 2025
Current assets:
Cash and cash equivalents
$
996,710
$
713,049
$
882,488
Restricted cash
15,504
14,690
15,945
Accounts receivable (less allowance for credit losses of $8,884, $8,585 and $8,011)
460,243
522,712
325,297
Inventories, net
631,649
718,267
722,106
Prepaid expenses and other
30,593
31,497
30,294
Total current assets
2,134,699
2,000,215
1,976,130
Plant, property and equipment, net
349,324
366,362
363,188
Goodwill
545,841
554,692
554,692
Other intangible assets, net
426,901
455,100
447,643
Operating lease right-of-use assets
189,559
220,182
222,863
Other assets
143,629
60,771
61,127
Total
$
3,789,953
$
3,657,322
$
3,625,643
Current liabilities:
Accounts payable
$
217,277
$
210,926
$
234,618
Accrued expenses
295,689
294,395
247,213
Current lease liabilities
50,686
56,779
56,865
Current portion of long-term debt
55
81
62
Total current liabilities
563,707
562,181
538,758
Long-term debt
1,193,003
1,191,179
1,191,641
Long-term lease liabilities
164,849
188,307
191,739
Deferred income taxes and other long-term obligations
121,493
125,125
118,572
Equity:
Common stock ($0.01 par value; 9,650,221 shares outstanding at June 27, 2026, June 28, 2025 and September 27, 2025)
97
97
97
Class A common stock ($0.01 par value: 51,290,706, 51,556,941 and 51,618,682 shares outstanding at June 27, 2026, June 28, 2025 and September 27, 2025, respectively)
513
516
516
Class B stock ($0.01 par value: 1,602,374 shares outstanding at June 27, 2026, June 28, 2025 and September 27, 2025)
16
16
16
Additional paid-in capital
573,770
566,236
571,392
Retained earnings
1,175,716
1,024,902
1,015,096
Accumulated other comprehensive loss
(4,442
)
(3,532
)
(3,849
)
Total Central Garden & Pet Company shareholders’ equity
1,745,670
1,588,235
1,583,268
Noncontrolling interest
1,231
2,295
1,665
Total equity
1,746,901
1,590,530
1,584,933
Total
$
3,789,953
$
3,657,322
$
3,625,643
CENTRAL GARDEN & PET COMPANY
(in thousands, except per share amounts, unaudited)
Three Months Ended
Nine Months Ended
June 27, 2026
June 28, 2025
June 27, 2026
June 28, 2025
Net sales
$
882,362
$
960,913
$
2,405,887
$
2,450,886
Cost of goods sold
565,444
628,903
1,598,797
1,650,094
Gross profit
316,918
332,010
807,090
800,792
Selling, general and administrative expenses
191,074
196,884
550,777
544,350
Operating income
125,844
135,126
256,313
256,442
Interest expense
(14,279
)
(14,360
)
(42,858
)
(43,340
)
Interest income
6,512
5,517
18,240
17,409
Other income
1,511
1,069
1,342
96
Income before income taxes and noncontrolling interest
119,588
127,352
233,037
230,607
Income tax expense
29,596
31,941
56,214
56,208
Income including noncontrolling interest
89,992
95,411
176,823
174,399
Net income attributable to noncontrolling interest
136
404
705
1,750
Net income attributable to Central Garden & Pet Company
$
89,856
$
95,007
$
176,118
$
172,649
Net income per share attributable to Central Garden & Pet Company:
Basic
$
1.46
$
1.53
$
2.87
$
2.72
Diluted
$
1.45
$
1.52
$
2.84
$
2.69
Weighted average shares used in the computation of net income per share:
Basic
61,452
61,980
61,409
63,557
Diluted
61,947
62,610
61,925
64,283
CENTRAL GARDEN & PET COMPANY
(in thousands, unaudited)
Nine Months Ended
June 27, 2026
June 28, 2025
Cash flows from operating activities:
Net income
$
176,823
$
174,399
Adjustments to reconcile net income to net cash used in operating activities:
Depreciation and amortization
60,977
64,063
Amortization of deferred financing costs
1,879
2,021
Non-cash lease expense
43,725
45,118
Stock-based compensation
15,699
15,572
Gain on divestiture
(2,479
)
—
Deferred income taxes
4,481
4,587
Other operating activities
1,898
(1,851
)
Changes in assets and liabilities (excluding businesses acquired):
Accounts receivable
(130,770
)
(195,704
)
Inventories
22,268
39,800
Prepaid expenses and other assets
2,522
(3,992
)
Accounts payable
8,189
(1,471
)
Accrued expenses
47,630
48,390
Other long-term obligations
(1,548
)
2,831
Operating lease liabilities
(43,699
)
(43,983
)
Net cash provided by operating activities
207,595
149,780
Cash flows from investing activities:
Additions to property, plant and equipment
(33,851
)
(30,580
)
Payments to acquire companies, net of cash acquired
(57,720
)
(3,318
)
Proceeds from divestiture
30,644
—
Other investing activities
(50
)
(150
)
Net cash used in investing activities
(60,977
)
(34,048
)
Cash flows from financing activities:
Repayments of long-term debt
(53
)
(202
)
Repurchase of common stock, including shares surrendered for tax withholding
(28,822
)
(154,734
)
Distribution to noncontrolling interest
(1,139
)
(1,346
)
Payment of financing costs
(2,329
)
—
Net cash used in financing activities
(32,343
)
(156,282
)
Effect of exchange rate changes on cash and equivalents
(494
)
(114
)
Net increase/(decrease) in cash, cash equivalents and restricted cash
113,781
(40,664
)
Cash, cash equivalents and restricted cash at beginning of year
898,433
768,403
Cash, cash equivalents and restricted cash at end of period
$
1,012,214
$
727,739
Supplemental information:
Cash paid for interest
$
48,291
$
48,778
Cash paid for income taxes – net of refunds
$
35,295
$
44,281
Lease liabilities arising from obtaining right-of-use assets
$
9,519
$
56,833
Use of Non-GAAP Financial Measures
We report our financial results in accordance with GAAP. However, to supplement the financial results prepared in accordance with GAAP, we use non-GAAP financial measures including non-GAAP net income and diluted net income per share, non-GAAP operating income, organic net sales and adjusted EBITDA. Management uses these non-GAAP financial measures that exclude the impact of specific items (described below) in making financial, operating and planning decisions and in evaluating our performance. Also, management believes that these non-GAAP financial measures may be useful to investors in their assessment of our ongoing operating performance and provide additional meaningful comparisons between current results and results in prior operating periods. While management believes that non-GAAP measures are useful supplemental information, such adjusted results are not intended to replace our GAAP financial results and should be read in conjunction with those GAAP results.
We have also provided organic net sales, a non-GAAP measure that excludes the impact of businesses purchased or exited in the prior 12 months, because we believe it permits investors to better understand the performance of our historical business without the impact of recent acquisitions or dispositions.
Adjusted EBITDA is defined by us as income before income tax, net other expense, net interest expense and depreciation and amortization and stock-based compensation expense (or operating income plus depreciation and amortization expense and stock-based compensation expense). Adjusted EBITDA further excludes charges related to facility closures. We present adjusted EBITDA because we believe that adjusted EBITDA is a useful supplemental measure in evaluating the cash flows and performance of our business and provides greater transparency into our results of operations. Adjusted EBITDA is used by our management to perform such evaluations. Adjusted EBITDA should not be considered in isolation or as a substitute for cash flow from operations, income from operations or other income statement measures prepared in accordance with GAAP. We believe that adjusted EBITDA is frequently used by investors, securities analysts and other interested parties in their evaluation of companies, many of which present adjusted EBITDA when reporting their results. Other companies may calculate adjusted EBITDA differently and it may not be comparable.
The reconciliations of these non-GAAP measures to the most directly comparable financial measures calculated and presented in accordance with GAAP are shown in the tables below.
Non-GAAP financial measures reflect adjustments based on the following items:
Facility closures and business exit: we have excluded charges related to the closure of distribution and manufacturing facilities and our decisions to exit businesses as they represent infrequent transactions that impact the comparability between operating periods.
Tariff refunds: we have excluded the impact of tariff refunds received for certain tariffs previously imposed under the International Emergency Economic Powers Act which were deemed unconstitutional. We believe the tariff refund amounts we have received represent infrequent transactions that impact the comparability between operating periods.
Business contribution to new pet distribution partnership formation: we have excluded the gain related to the divestiture of the pet distribution business and its contribution to the formation of a partnership as it represents an infrequent transaction that impacts the comparability between operating periods.
From time to time in the future, there may be other items that we may exclude if we believe that doing so is consistent with the goal of providing useful supplemental information to investors and management.
We have not provided a reconciliation of non-GAAP measures to the corresponding GAAP measures on a forward-looking basis as we cannot do so without unreasonable efforts due to the potential variability and limited visibility of excluded items; these excluded items may include facility closures and exit costs, impairment charges and restructuring costs, among others.
During the third quarter of fiscal 2026, we recognized incremental expense of $13.8 million in the consolidated statement of operations, of which $13.0 million in our Pet segment related to the exit of a minor business and the closure of two facilities, and $0.8 million in our Garden segment related to the closure of three distribution centers in fiscal 2025 and 2024.
During the third quarter of fiscal 2026, we recognized incremental income in our Pet segment of $3.6 million for tariff refunds received.
During the third quarter of fiscal 2026, we recognized incremental income of $2.5 million in Other Income from the contribution of our pet distribution business to the formation of a new new partnership.
During the first six months of fiscal 2026, we recognized incremental expense of $8.0 million in the condensed consolidated statement of operations, of which $7.3 million in our Garden segment related to the closure of three distribution centers in fiscal 2025 and 2024 and $0.7 million in our Pet segment related to the closure of a sales and logistics facility in Pennsylvania.
During the third quarter of fiscal 2025, we recognized incremental expense of $3.9 million in the consolidated statement of operations, $2.2 million in our Garden segment related to closing a distribution facility in Ontario, California and beginning the consolidation of our Western distribution network and an incremental $1.7 million in our Pet segment related to the decision to winddown our operations in the U.K.
During the second quarter of fiscal 2025, we recognized incremental expense of $5.3 million in the condensed consolidated statement of operations, related to the decision to wind-down our operations in the U.K. and the related facility there as we move to a direct-export model.
Net Income and Diluted Net Income Per Share
GAAP to Non-GAAP Reconciliation
Three Months Ended
Nine Months Ended
June 27, 2026
June 28, 2025
June 27, 2026
June 28, 2025
(in thousands, except per share amounts)
GAAP net income attributable to Central Garden & Pet Company
$
89,856
$
95,007
$
176,118
$
172,649
Facility closures
(1) (4) (5) (6)
13,757
3,915
21,729
9,254
Tariff refunds
(2)
(3,606
)
—
(3,606
)
—
Pet distribution business divestiture
(3)
(2,479
)
—
(2,479
)
—
Tax effect of adjustments
(1,900
)
(1,003
)
(3,770
)
(2,258
)
Non-GAAP net income attributable to Central Garden & Pet Company
$
95,628
$
97,919
$
187,992
$
179,645
GAAP diluted net income per share
$
1.45
$
1.52
$
2.84
$
2.69
Non-GAAP diluted net income per share
$
1.54
$
1.56
$
3.04
$
2.79
Shares used in GAAP and non-GAAP diluted net earnings per share calculation
61,947
62,610
61,925
64,283
Operating Income
GAAP to Non-GAAP Reconciliation
Three Months Ended June 27, 2026
Nine Months Ended June 27, 2026
Non-GAAP adjustments
Non-GAAP
Non-GAAP adjustments
Non-GAAP
(in thousands)
Net sales
$
882,362
$
1,354
$
883,716
$
2,405,887
$
1,354
$
2,407,241
Cost of goods sold
565,444
129
565,573
1,598,797
646
1,599,443
Gross profit
$
316,918
$
1,225
$
318,143
$
807,090
$
708
$
807,798
Selling, general and administrative expenses
191,074
(8,926
)
182,148
550,777
(17,415
)
533,362
Income from operations
(1) (2) (4)
$
125,844
$
10,151
$
135,995
$
256,313
$
18,123
$
274,436
Gross margin
35.9
%
36.0
%
33.5
%
33.6
%
Operating margin
14.3
%
15.4
%
10.7
%
11.4
%
Operating Income
GAAP to Non-GAAP Reconciliation
Three Months Ended June 28, 2025
Nine Months Ended June 28, 2025
Non-GAAP adjustments
Non-GAAP
Non-GAAP adjustments
Non-GAAP
(in thousands)
Net sales
$
960,913
$
—
$
960,913
$
2,450,886
$
—
$
2,450,886
Cost of goods sold
628,903
(248
)
628,655
1,650,094
(4,661
)
1,645,433
Gross profit
$
332,010
$
248
$
332,258
$
800,792
$
4,661
$
805,453
Selling, general and administrative expenses
196,884
(3,667
)
193,217
544,350
(4,593
)
539,757
Income from operations
(5) (6)
$
135,126
$
3,915
$
139,041
$
256,442
$
9,254
$
265,696
Gross margin
34.6
%
34.6
%
32.7
%
32.9
%
Operating margin
14.1
%
14.5
%
10.5
%
10.8
%
Pet Segment Operating Income
GAAP to Non-GAAP Reconciliation
Three Months Ended
Nine Months Ended
June 27, 2026
June 28, 2025
June 27, 2026
June 28, 2025
(in thousands)
GAAP operating income
$
66,818
$
76,199
$
194,440
$
188,070
Facility closures
(1) (4) (5) (6)
12,963
1,671
13,696
7,010
Tariff refunds received
(2)
(3,606
)
—
(3,606
)
—
Non-GAAP operating income
$
76,175
$
77,870
$
204,530
$
195,080
GAAP operating margin
16.7
%
15.5
%
15.0
%
13.7
%
Non-GAAP operating margin
19.0
%
15.8
%
15.8
%
14.2
%
Garden Segment Operating Income
GAAP to Non-GAAP Reconciliation
Three Months Ended
Nine Months Ended
June 27, 2026
June 28, 2025
June 27, 2026
June 28, 2025
(in thousands)
GAAP operating income
$
90,051
$
82,989
$
146,340
$
144,143
Facility closures
(1) (4) (5)
794
2,244
8,033
2,244
Non-GAAP operating income
$
90,845
$
85,233
$
154,373
$
146,387
GAAP operating margin
18.7
%
17.7
%
13.2
%
13.4
%
Non-GAAP operating margin
18.9
%
18.2
%
13.9
%
13.6
%
Organic Net Sales
GAAP to Non-GAAP Reconciliation
Three Months Ended June 27, 2026
Nine Months Ended June 27, 2026
Net sales (GAAP)
Effect of acquisitions & divestitures on net sales
Net sales organic
Net sales (GAAP)
Effect of acquisitions & divestitures on net sales
Net sales organic
(in millions)
Q3 FY 26
$
882.4
$
20.2
$
862.2
$
2,405.9
$
237.2
$
2,168.7
Q3 FY 25
960.9
118.7
842.2
2,450.9
351.7
2,099.2
$ increase (decrease)
$
(78.5
)
$
20.0
$
(45.0
)
$
69.5
% increase (decrease)
(8.2
)%
2.4
%
(1.8
)%
3.3
%
Organic Pet Segment Net Sales
GAAP to Non-GAAP Reconciliation
Three Months Ended June 27, 2026
Nine Months Ended June 27, 2026
Net sales (GAAP)
Effect of acquisitions & divestitures on net sales
Net sales organic
Net sales (GAAP)
Effect of acquisitions & divestitures on net sales
Net sales organic
(in millions)
Q3 FY 26
$
400.5
$
20.2
$
380.3
$
1,293.1
$
237.2
$
1,055.9
Q3 FY 25
492.5
118.7
373.8
1,373.7
351.7
1,022.0
$ increase (decrease)
$
(92.0
)
$
6.5
$
(80.6
)
$
33.9
% increase (decrease)
(18.7
)%
1.7
%
(5.9
)%
3.3
%
Adjusted EBITDA
GAAP to Non-GAAP Reconciliation
Three Months Ended June 27, 2026
Pet
Garden
Corporate
Total
(in thousands)
Net income attributable to Central Garden & Pet Company
$
—
$
—
$
—
$
89,856
Interest expense, net
—
—
—
7,767
Other income
—
—
—
(1,511
)
Income tax expense
—
—
—
29,596
Net income attributable to noncontrolling interest
—
—
—
136
Income (loss) from operations
66,818
90,051
(31,025
)
$
125,844
Depreciation & amortization
9,418
9,987
229
19,634
Noncash stock-based compensation
—
—
6,245
6,245
Facility closures and tariff refunds received
(1) (2)
9,357
794
—
10,151
Adjusted EBITDA
$
85,593
$
100,832
$
(24,551
)
$
161,874
Adjusted EBITDA
GAAP to Non-GAAP Reconciliation
Three Months Ended June 28, 2025
Pet
Garden
Corporate
Total
(in thousands)
Net income attributable to Central Garden & Pet Company
$
—
$
—
$
—
$
95,007
Interest expense, net
—
—
—
8,843
Other income
—
—
—
(1,069
)
Income tax expense
—
—
—
31,941
Net income attributable to noncontrolling interest
—
—
—
404
Income (loss) from operations
76,199
82,989
(24,062
)
$
135,126
Depreciation & amortization
10,391
10,383
709
21,483
Noncash stock-based compensation
—
—
6,044
6,044
Facility closures & business exit
(5)
1,671
2,244
—
3,915
Adjusted EBITDA
$
88,261
$
95,616
$
(17,309
)
$
166,568
Adjusted EBITDA
GAAP to Non-GAAP Reconciliation
Nine Months Ended June 27, 2026
Pet
Garden
Corporate
Total
(in thousands)
Net income attributable to Central Garden & Pet Company
$
—
$
—
$
—
$
176,118
Interest expense, net
—
—
—
24,618
Other income
—
—
—
(1,342
)
Income tax expense
—
—
—
56,214
Net income attributable to noncontrolling interest
—
—
—
705
Income (loss) from operations
194,440
146,340
(84,467
)
$
256,313
Depreciation & amortization
30,017
30,252
708
60,977
Noncash stock-based compensation
—
—
15,699
15,699
Facility closures and tariff refunds received
(1) (2) (4)
10,090
8,033
—
18,123
Adjusted EBITDA
$
234,547
$
184,625
$
(68,060
)
$
351,112
Adjusted EBITDA
GAAP to Non-GAAP Reconciliation
Nine Months Ended June 28, 2025
Pet
Garden
Corporate
Total
(in thousands)
Net income attributable to Central Garden & Pet Company
$
—
$
—
$
—
$
172,649
Interest expense, net
—
—
—
25,931
Other income
—
—
—
(96
)
Income tax expense
—
—
—
56,208
Net income attributable to noncontrolling interest
—
—
—
1,750
Income (loss) from operations
188,070
144,144
(75,772
)
$
256,442
Depreciation & amortization
29,969
31,957
2,137
64,063
Noncash stock-based compensation
—
—
15,572
15,572
Facility closures and business exit
(5) (6)
7,010
2,244
—
9,254
Adjusted EBITDA
$
225,049
$
178,345
$
(58,063
)
$
345,331
View source version on businesswire.com:https://www.businesswire.com/news/home/20260805868011/en/
CONTACT: Investor & Media Contact
Friederike Edelmann
VP, Investor Relations & Corporate Sustainability
(925) 412-6726
fedelmann@central.com
KEYWORD: CALIFORNIA UNITED STATES NORTH AMERICA
INDUSTRY KEYWORD: RETAIL CONSUMER OTHER RETAIL HOME GOODS PETS CONSTRUCTION & PROPERTY LANDSCAPE
SOURCE: Central Garden & Pet Company
Copyright Business Wire 2026.
PUB: 08/05/2026 04:01 PM/DISC: 08/05/2026 04:01 PM
http://www.businesswire.com/news/home/20260805868011/en
Source: “AOL Money”
